Applying colour conditional formatting to individual table columns in Tableau
Do you want to conditionally format one column in a Tableau table but attempting to apply colour to a column applies it to everything?
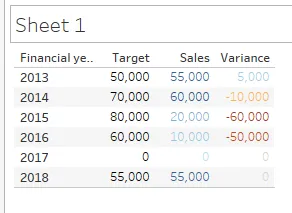
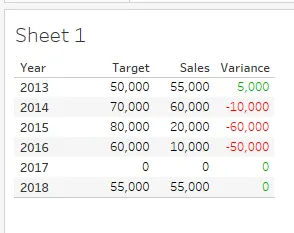
For example, say I have the following table:
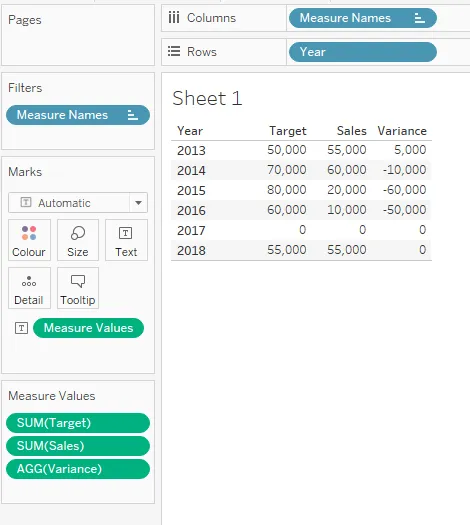
I want to conditionally format the Variance column so that at a glance I can see, based on the colour of the numbers in that column, whether a profit was made that year or not.
Unfortunately dropping the Variance measure on Colour applies it to all columns/rows:
The solution
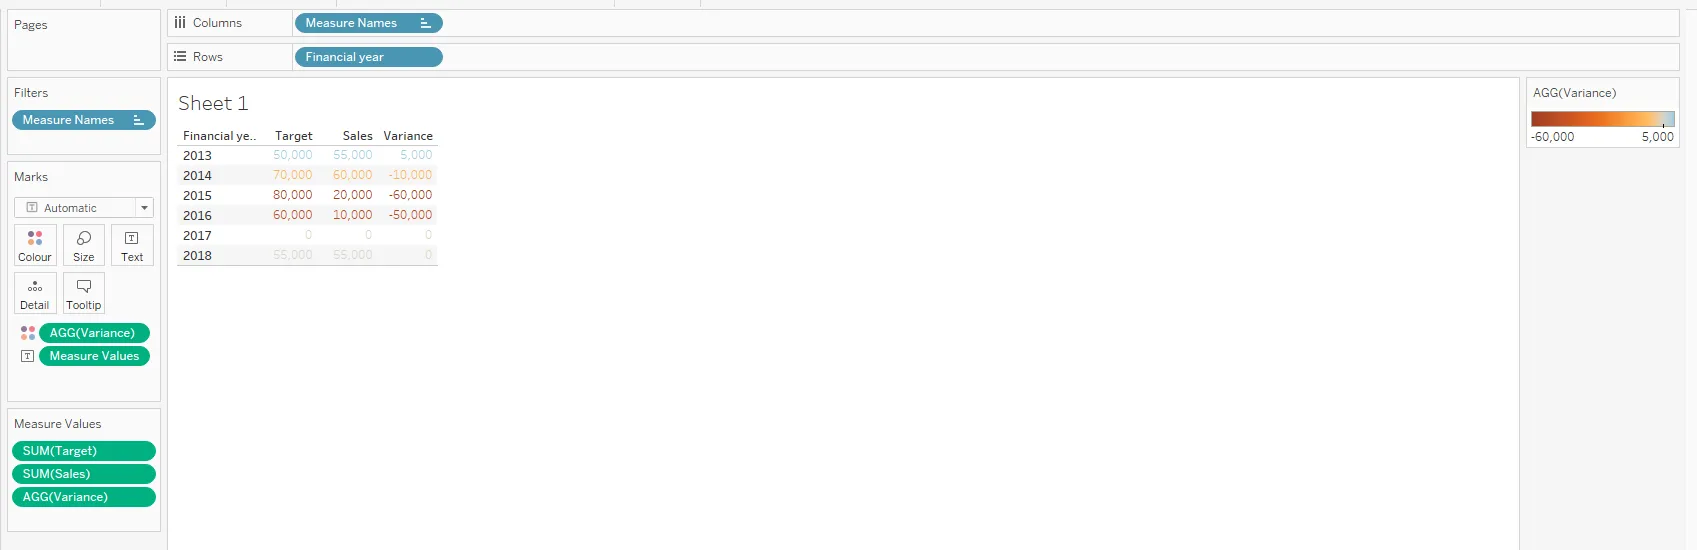
1) Drop Measure Values on to Colour:
2) Right click the Measure Values colour and click ‘Use separate legends’:
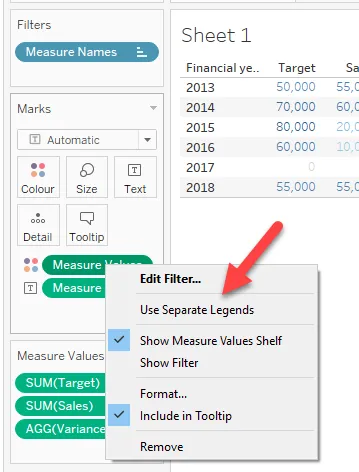
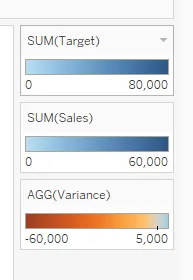
What this does is create a separate colour legend/scale for each column, which you can see on the right side of your screen:
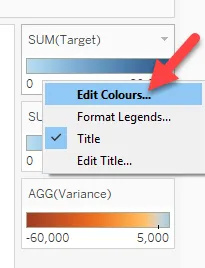
3) This is where the magic happens. You’ll want to edit all 3 (or however many columns you have) one at a time, by right clicking and selecting Edit Colours:
Essentially what we want to do now is ensure that the colour palette that we’re editing only display the same colour (for our columns that we don’t want to conditionally format).
To do so click the drop-down menu that currently says ‘Automatic’ and select ‘Custom Diverging’, reduce the Stepped Colour to 2 and then make sure both ends of the scale are the same colour:
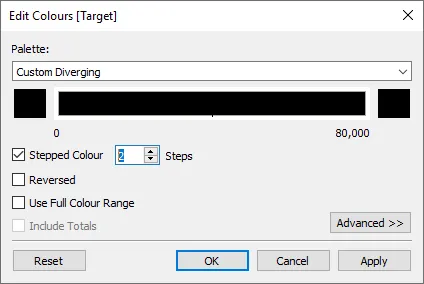
This will ensure that no matter the value of the column it will be the same colour:
Once you’ve finished updating all the columns you don’t want conditionally formatted, you can focus on the remaining column/s that you do want colour conditional formatting applied to.
It’s the exact same process except you’ll want to choose two different colours for the different ends of the scale.
In this example, let’s use red for any Variance values under 0 and green for any values over 0:
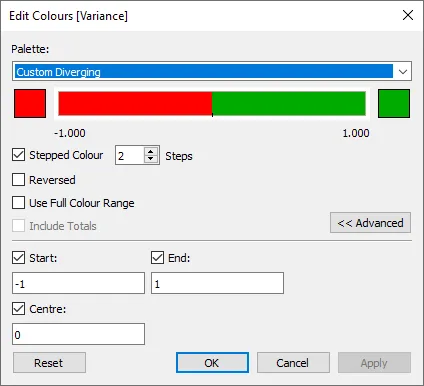
You’ll notice that I’ve specified the centre of the scale is 0, meaning any value in the Variance column that is 0 or higher will be coloured green and any value that is less than 0 will be red.
Let’s see how our table looks now:
Perfect!
Rather than two colours only you can use a scale — just increase the stepped colours and choose your own colours/choose a different palette.
Comments !