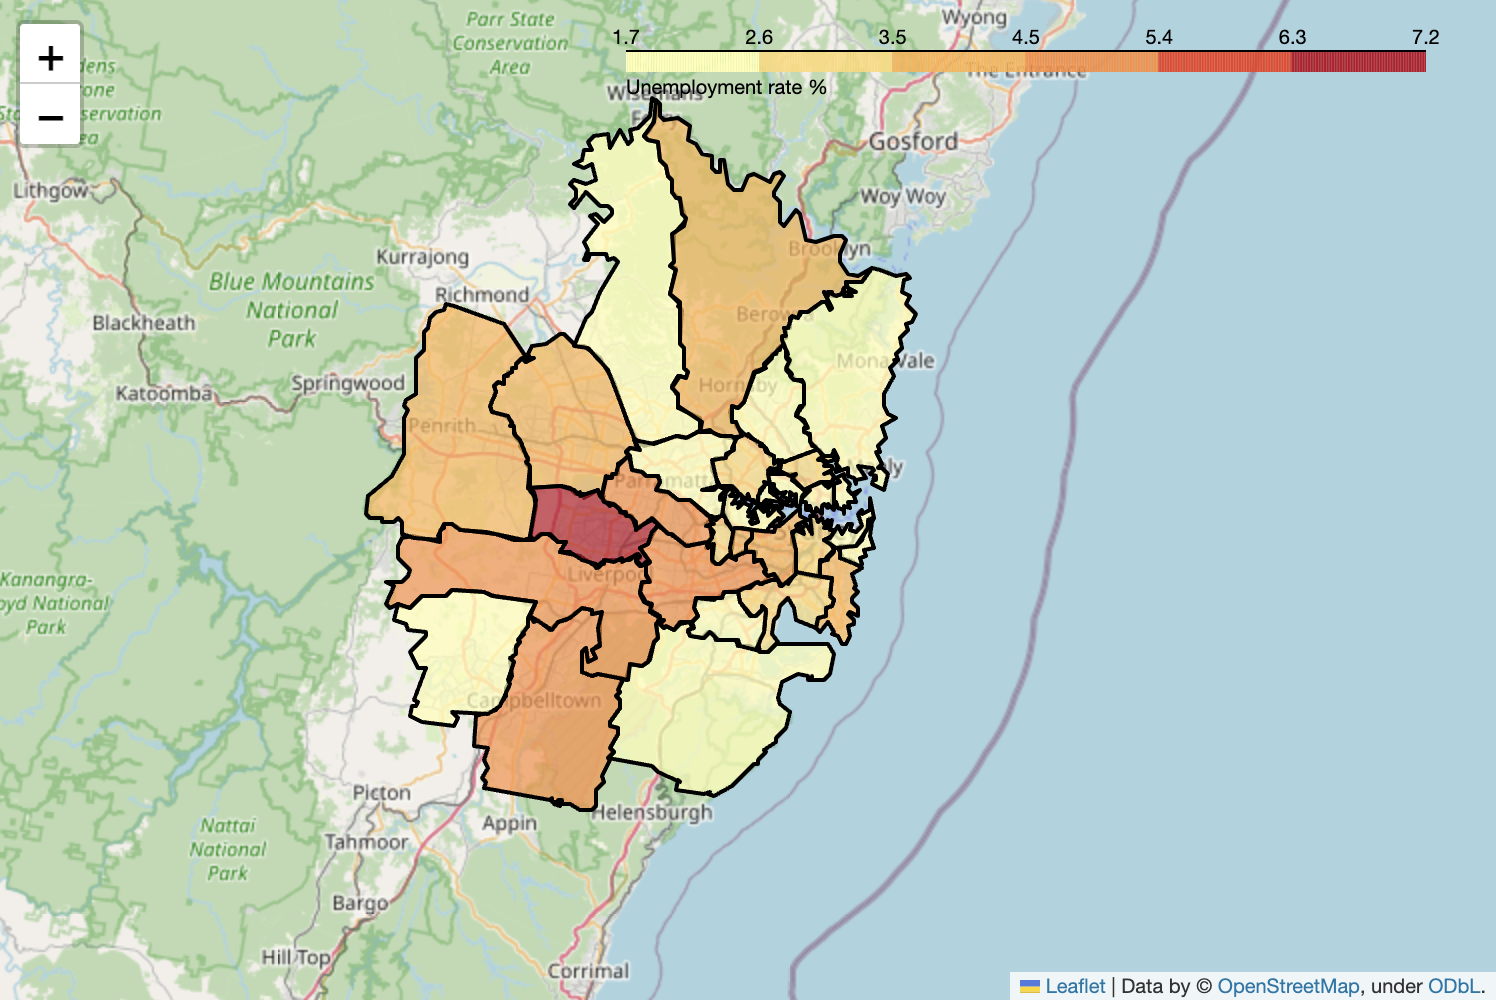
Which Sydney LGAs have the lowest and highest unemployment rates?
The Australian government's Jobs and Skills Australia has an insightful dataset I recently came across - quarterly Small Area Labour Markets (SALM) estimates of unemployment and the unemployment rate, broken out by local government area (LGA).
You can see with the interactive map here or at the end of this article.
How I did it
I sourced a GeoJSON file of Greater Sydney LGAs from UNSW's CityData platform.
import folium
import requests
import pandas as pd

response = requests.get("https://staging.citydata.be.unsw.edu.au/geoserver/geonode/ows?service=WFS&version=1.0.0&request=GetFeature&typeName=geonode:LGAs_Sydney_and_surrounds&outputFormat=application%2Fjson")
geojson = response.json()
There was some typical data cleaning that I needed to apply to the unemployment dataset (making more readable column headers, converting the data type).
df = pd.read_csv('unemployment.csv')
df = df[['Data item', 'Local Government Area (LGA) (2023 ASGS)', 'Jun-23']]
df = df.query("`Data item` == 'Smoothed unemployment rate (%)'")
df = df.rename(columns={'Local Government Area (LGA) (2023 ASGS)':'LGA', 'Jun-23':'unemployment_rate'})
df['unemployment_rate'] = pd.to_numeric(df['unemployment_rate'], errors='coerce')
But the big issue was that unfortunately not all the LGA names in the CSV matched the LGA names in the GeoJSON file so I had manually updated these records to reflect the naming used in the GeoJSON file.
# Printing the names of the LGAs in the GeoJSON file.
lgas = []
for number in range(0, len(geojson['features'])):
    lga = geojson['features'][number]['properties']['NSW_LGA__3']
    lgas.append(lga)

lgas = list(set(lgas))
geojson_lgas = pd.Series(lgas)
geojson_lgas.name = 'LGA'
geojson_lgas
0         SUTHERLAND SHIRE
1                  BURWOOD
2                LANE COVE
3               WILLOUGHBY
4               INNER WEST
5              STRATHFIELD
6               CUMBERLAND
7           UNINCORPORATED
8                 WAVERLEY
9                  BAYSIDE
10              HAWKESBURY
11                  CAMDEN
12             WOLLONDILLY
13            CAMPBELLTOWN
14               LIVERPOOL
15          BLUE MOUNTAINS
16               FAIRFIELD
17             KU-RING-GAI
18              CANADA BAY
19                 PENRITH
20                 HORNSBY
21                    RYDE
22         THE HILLS SHIRE
23                  SYDNEY
24           CENTRAL COAST
25        NORTHERN BEACHES
26    CANTERBURY-BANKSTOWN
27            NORTH SYDNEY
28            HUNTERS HILL
29                  MOSMAN
30                RANDWICK
31               BLACKTOWN
32           GEORGES RIVER
33               WOOLLAHRA
34              PARRAMATTA
Name: LGA, dtype: object
# Updating LGA names in the unemployment DataFrame.
df['LGA'] = df['LGA'].str.upper()
df.at[1107, 'LGA'] = 'CAMPBELLTOWN'
df.at[1195, 'LGA'] = 'THE HILLS SHIRE'
df.at[1091, 'LGA'] = 'BAYSIDE'
df.at[1190, 'LGA'] = 'SUTHERLAND SHIRE'
df.at[1111, 'LGA'] = 'CENTRAL COAST'

df
| Data item | LGA | unemployment_rate | |
|---|---|---|---|
| 1086 | Smoothed unemployment rate (%) | ALBURY | 4.5 |
| 1087 | Smoothed unemployment rate (%) | ARMIDALE | 2.8 |
| 1088 | Smoothed unemployment rate (%) | BALLINA | 1.7 |
| 1089 | Smoothed unemployment rate (%) | BALRANALD | 1.8 |
| 1090 | Smoothed unemployment rate (%) | BATHURST | 1.6 |
| ... | ... | ... | ... |
| 1624 | Smoothed unemployment rate (%) | WAGAIT | 2.3 |
| 1625 | Smoothed unemployment rate (%) | WEST ARNHEM | 9.3 |
| 1626 | Smoothed unemployment rate (%) | WEST DALY | 13.0 |
| 1627 | Smoothed unemployment rate (%) | UNINCORPORATED NT | 5.2 |
| 1628 | Smoothed unemployment rate (%) | UNINCORPORATED ACT | 3.0 |
543 rows × 3 columns
I also needed to modify and recreate the GeoJSON file, to:
-
Add the unemployment rate to the properties of each Feature so the data can be passed to a tooltip popup in the map.
-
Remove suburbs not in Greater Sydney (this dataset includes surrounding LGAs like Hawkesbury and Central Coast).
# Setting the index on the unemployment DataFrame to LGA in order to pass the unemployment rate
# to the GeoJSON properties.
df['LGA_index'] = df['LGA']
df = df.set_index('LGA_index')

new_geojson = {'type':'FeatureCollection'}
# Creating a new GeoJSON file consisiting of only Greater Sydney suburbs
# and adding unemployment_rate to the Feature properties.
features = []
for feature in geojson['features']:
    if (feature_lga:= feature['properties']['NSW_LGA__3']) not in ('UNINCORPORATED', 'CENTRAL COAST', 'BLUE MOUNTAINS', 'WOLLONDILLY', 'HAWKESBURY'):
        try:
            unemployment_rate = df.at[feature_lga, 'unemployment_rate']
            unemployment_rate = str(unemployment_rate) + '%'
            feature['properties']['unemployment_rate'] = unemployment_rate
            features.append(feature)
        except KeyError:
            pass
new_geojson['features'] = features

lgas = []
for number in range(0, len(new_geojson['features'])):
    lga = new_geojson['features'][number]['properties']['NSW_LGA__3']
    lgas.append(lga)

# Creating a Series object from the new GeoJSON file.
lgas = list(set(lgas))
geojson_lgas = pd.Series(lgas)
geojson_lgas.name = 'LGA'
Finally I just had to inner join the two DataFrames to filter out LGAs that aren't in Sydney and then I could create the map!
sydney_lgas_unemployment = pd.merge(geojson_lgas, df, left_on="LGA", right_on="LGA")
m = folium.Map(location=[-33.8688, 151.2093], zoom_start=9.5)

choropleth = folium.Choropleth(
    geo_data=new_geojson,
    data=sydney_lgas_unemployment,
    columns=["LGA", "unemployment_rate"],
    key_on="feature.properties.NSW_LGA__3",
    fill_opacity=0.7,
    line_weight=2,
    fill_color="YlOrRd",
    highlight=True,
    legend_name="Unemployment rate %"
).add_to(m)

tooltip = folium.GeoJsonTooltip(fields=["NSW_LGA__3", "unemployment_rate"], aliases=["LGA", "Unemployment rate"])
choropleth.geojson.add_child(tooltip)

m.save('sydney_unemployment.html')
m
If you hover over the LGA you can see the name of the council as well as the unemployment rate.
As you can see, Fairfield has the highest unemployment rate and Camden has the lowest unemployment rate.
sydney_lgas_unemployment.sort_values('unemployment_rate').tail(1)
| LGA | Data item | unemployment_rate | |
|---|---|---|---|
| 12 | FAIRFIELD | Smoothed unemployment rate (%) | 7.2 |
sydney_lgas_unemployment.sort_values('unemployment_rate').head(1)
| LGA | Data item | unemployment_rate | |
|---|---|---|---|
| 9 | CAMDEN | Smoothed unemployment rate (%) | 1.7 |
For the source code/Jupyter notebook please see this Github repo.
Comments !